
13 Feb Leveraging DLI to Target When You Harvest
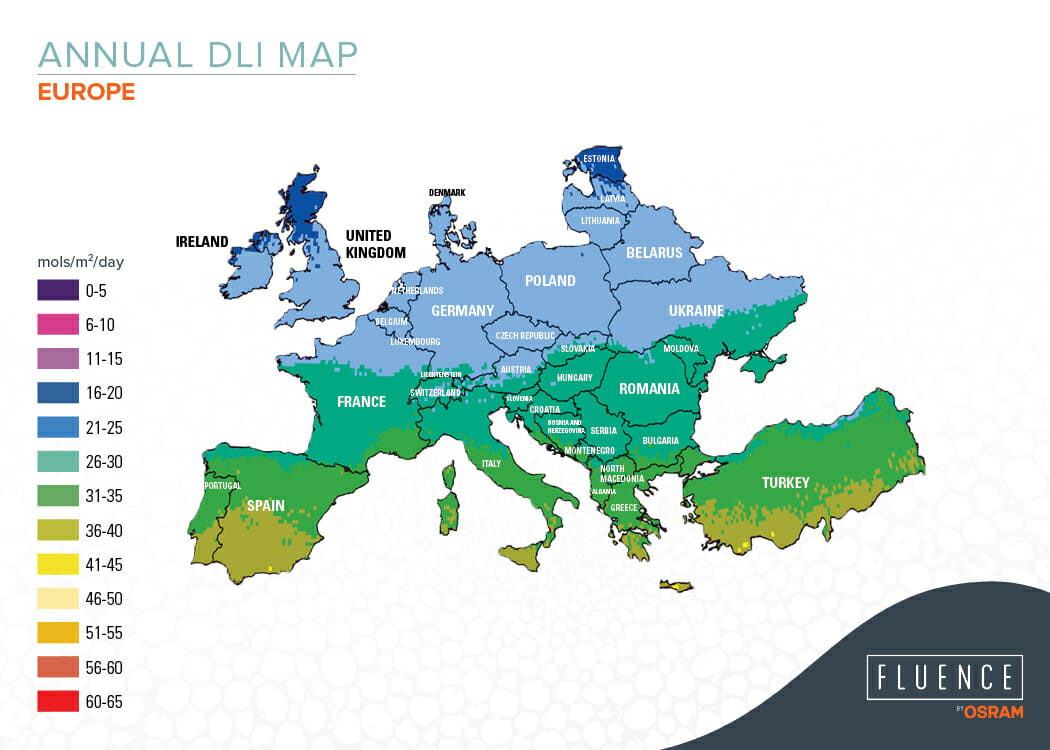
Thanks to the pioneering efforts of Joanne Logan at the University of Tennessee and Jim Faust at Clemson University, Fluence is pleased to offer annual Daily Light Integral (DLI) maps from around the world. These maps help illustrate how supplemental lighting can be leveraged to achieve higher crop yields. Understanding how much supplemental PAR light is needed to maximize crop yields is a critical limiting factor to crop health, and the annual DLI maps of outdoor sunlight in Australia, Canada, China, Columbia, Ecuador, Europe, Mexico, New Zealand, Russia, the Scandinavian peninsula, South Africa and the USA available now enable more farmers to consistently grow high quality crops.*


Growers understand that having DLI data, which proves exactly how little sunlight hits a certain region at a certain time of the year – and conversely, how much supplemental light should be used to reach an optimal PAR for the cultivar – can have a direct impact on the operational efficiency of their farm. This is why Fluence is releasing DLI maps of regions around the world to empower every farmer to look deeper into how their farm can be more efficient.
However, it is important to remember that these maps are just the start of a grower’s story.
Knowing how much light (e.g. 39.84 average DLI over a month) hitting a farm – without supplemental lighting – during a rainy spring month is one thing. While this level of sunlight is sufficient for most plants, knowing that three weeks of a particularly rainy spring month (providing ~20 DLI) sprinkled throughout one week of full sun (providing up to 61 DLI) tells an entirely different story about how the plant is affected. In this scenario, a harvest will occur much later than it would if supplemental lighting were used.
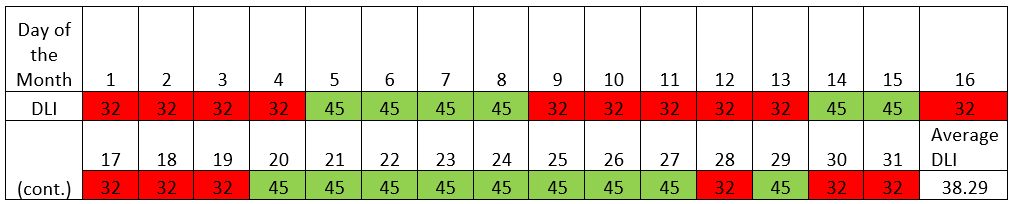
It’s important to consider the fact that plants do not look back on the month and remember how much sun they received on average. Like any malnourished living organism, an insufficient amount of light at a critical stage of development can stunt growth and ultimately affect the organism’s maturation. While the example of a dreary spring seems obvious, a similarly hazy summer month can return seemingly optimal DLI levels of 38.9 as well (Table 1 below) but could be providing suboptimal DLI levels on a daily basis, which could also affect maturation of the plant and delay your harvest during what you’ve traditionally experienced to be a fully productive month of cultivation.
Table 1: Example of how suboptimal lighting conditions during peak months of cultivation do occur due to abnormal weather, pollution, and other atmospheric events.
Contact the Fluence Sales team to learn more about what your crops are experiencing in real-time. Fluence can help you understand if inadequate lighting conditions are affecting your yields, crop quality or adding delays to your production schedule.
*Detailed maps of South America, the Middle East and Africa are coming soon.